The Graph tab of the Projects Window gives a visual representation of the data mapping that has been done thus far.
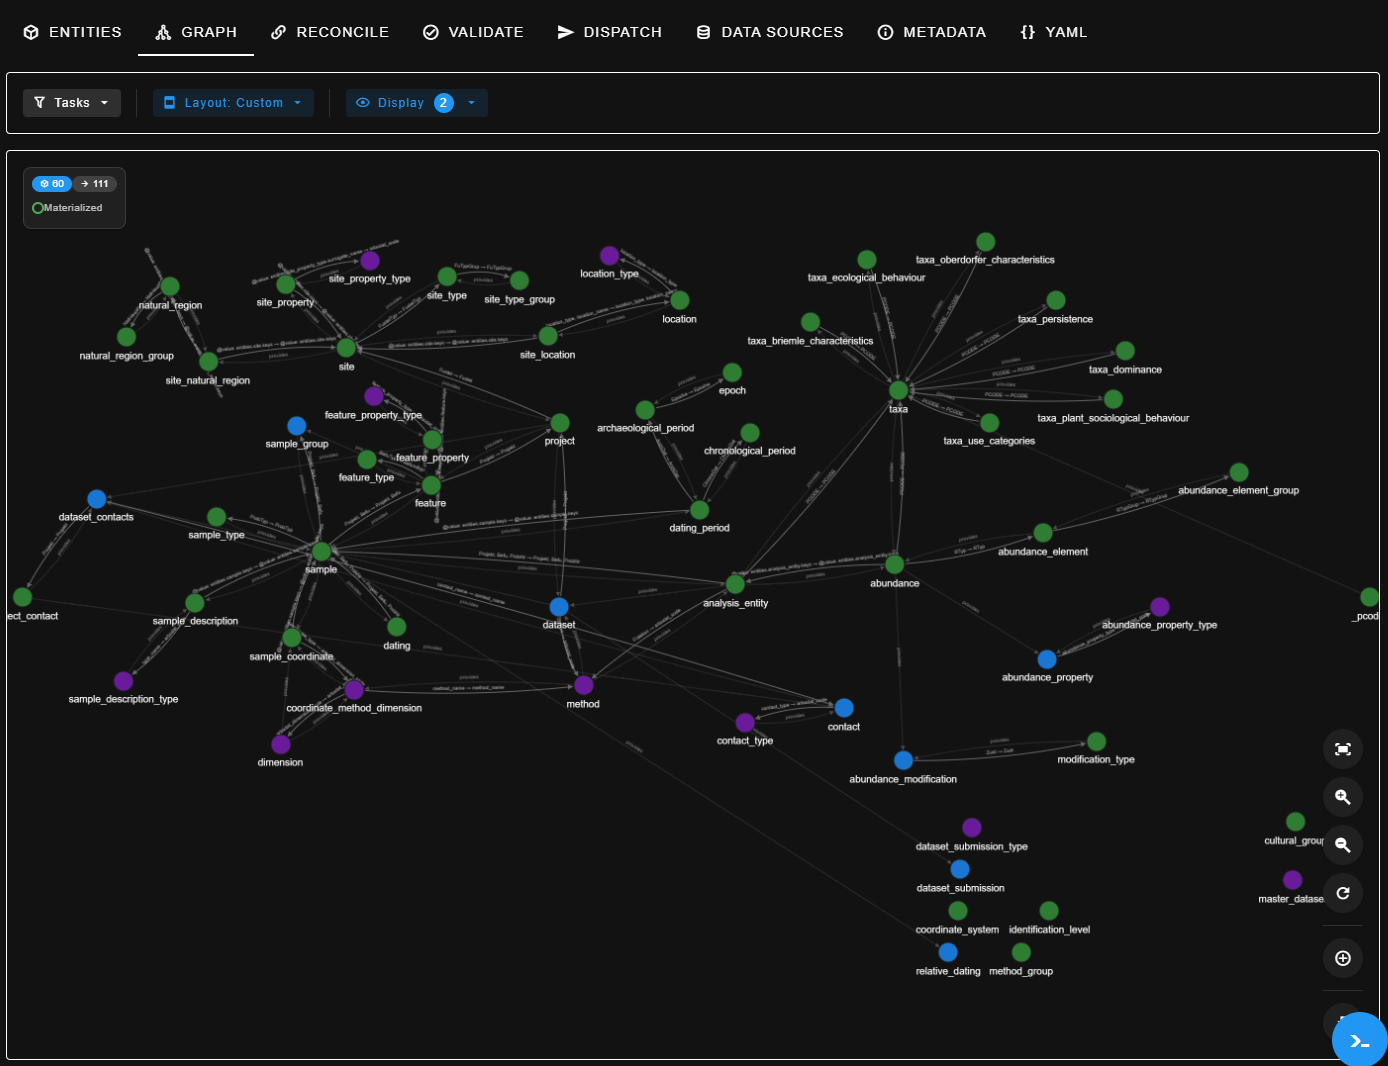
You can modify the appearance of the graph through the following buttons:
| Button | type of box | what is in the drop-down menu? | What do these mean in this context? |
|---|---|---|---|
| Tasks | drop-down | 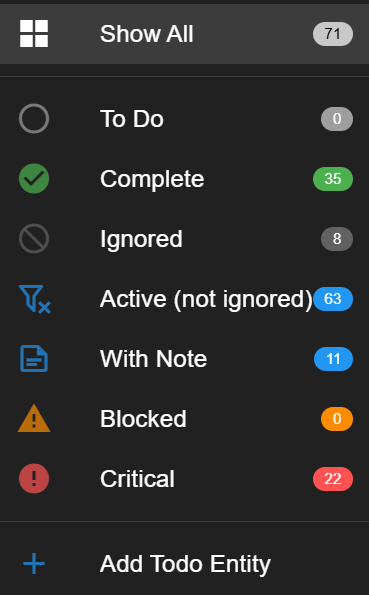 | Every entity can be assigned with a task status, and one can filter the graph to show only entities marked with a specific task (or in the case of “ignored”, one can filter to everything that is not set to be ignored) |
| Layout | drop-down | 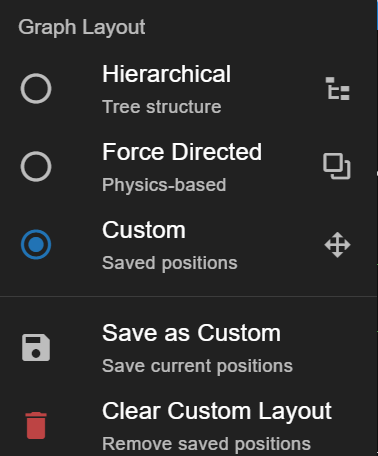 | See below for more details about: - Hierarchical Graph Layout - Force Distributed Layout |
| Task Status/Entity Type | drop-down | Task Status Entity Type | Changes the colour coding of the nodes displayed in the graph to either communicate each entity’s Task Status (To Do, Complete, Ignored, etc.), or their Entity Type (data derived, sql, fixed, etc.) |
Hierarchical Graph Layout
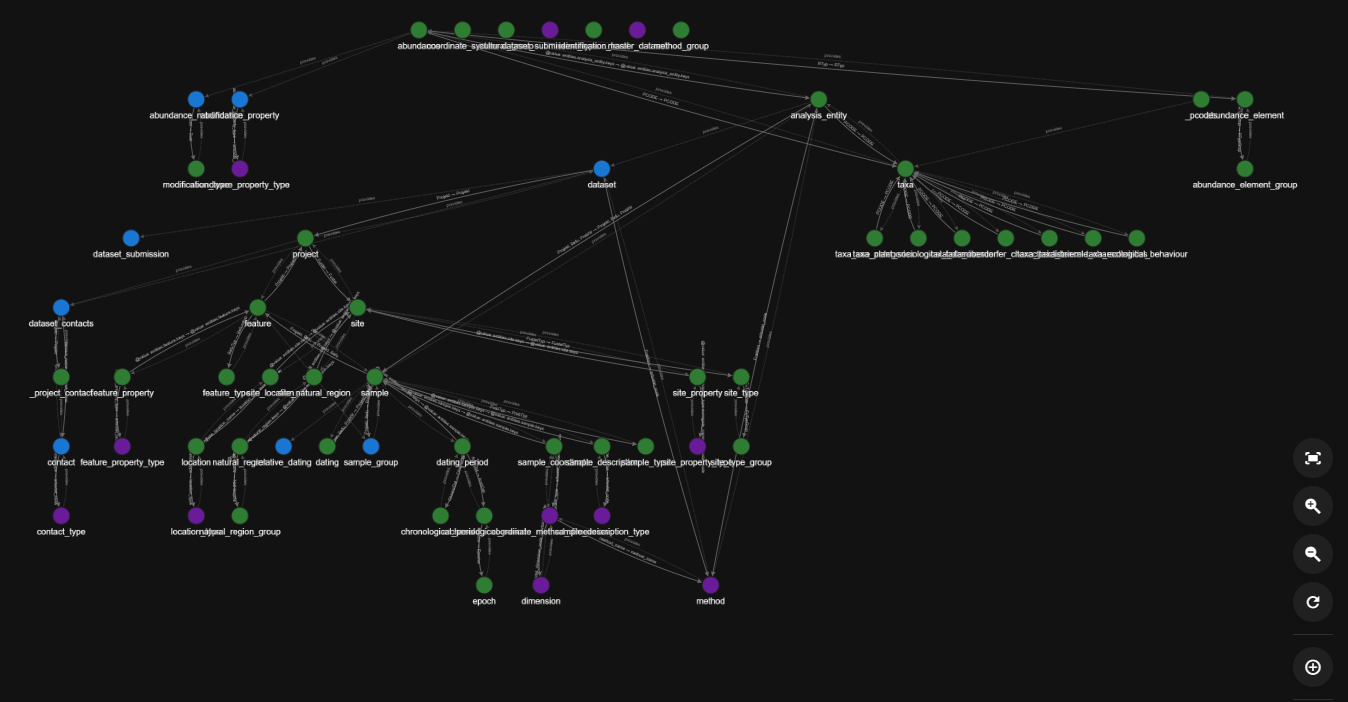
The Hierarchical Graph Layout option automatically arranges all of the displayed entities in rows based on their relationships, using a a top‑down or left‑to‑right “tree structure”, where:
- The entities are plotted as nodes with joins to related nodes
- Parent nodes appear above (or to the left of) their children
- Nodes that depend on others appear below or after them
- Each level of the graph is arranged in a straight, horizontal row
The resultant structure resembles an organisational chart or family tree:
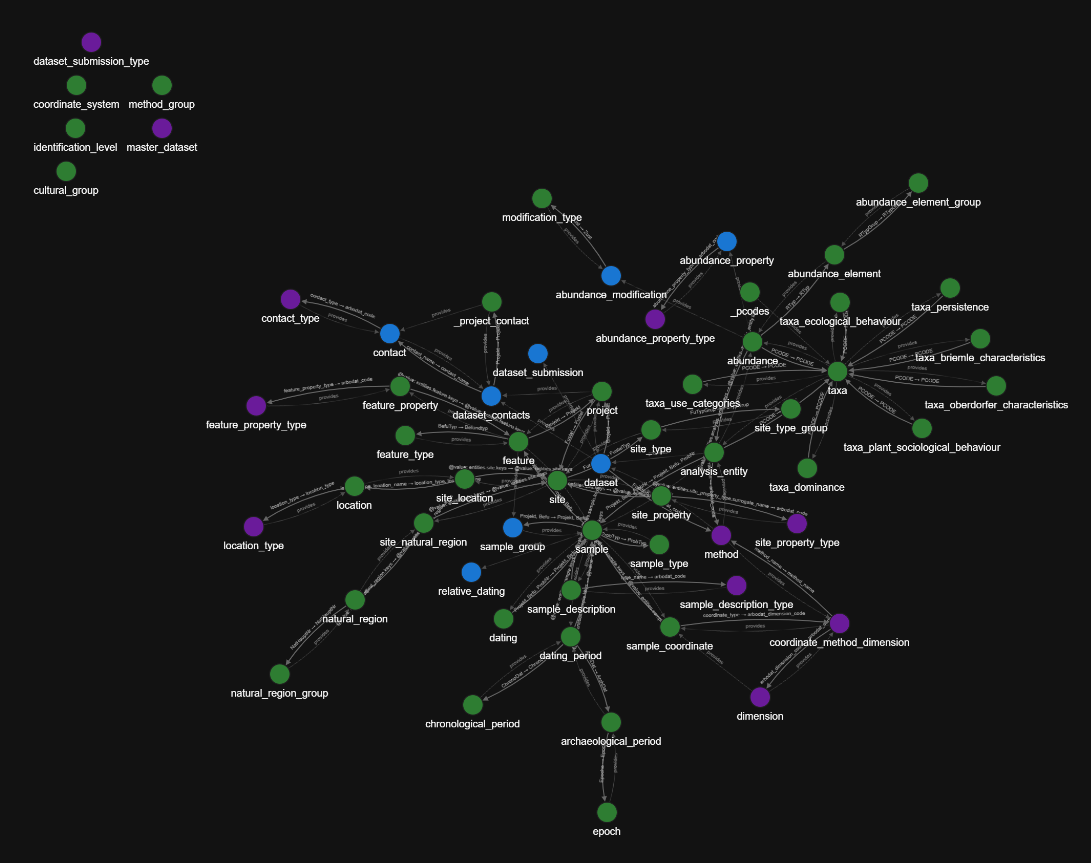
Force Distributed Layout
The Force Distributed Layout option automatically arranges all of the displayed entities by simulating physical forces—analogous to magnets or springs. The “forces” are calculated such that:
- Linked nodes gently pull toward each other
- Unrelated nodes push away from each other
- The overall graph shape “relaxes” into a balanced distribution
The resultant structure resembles a map of roads connecting cities, or a spider’s web:
Custom Layout
The Custom Layout allows you to choose the position of any of the nodes by clicking on them and dragging them to a new location, and to save the result. The last saved custom layout, if any will be displayed when you click on the Custom Layout option.
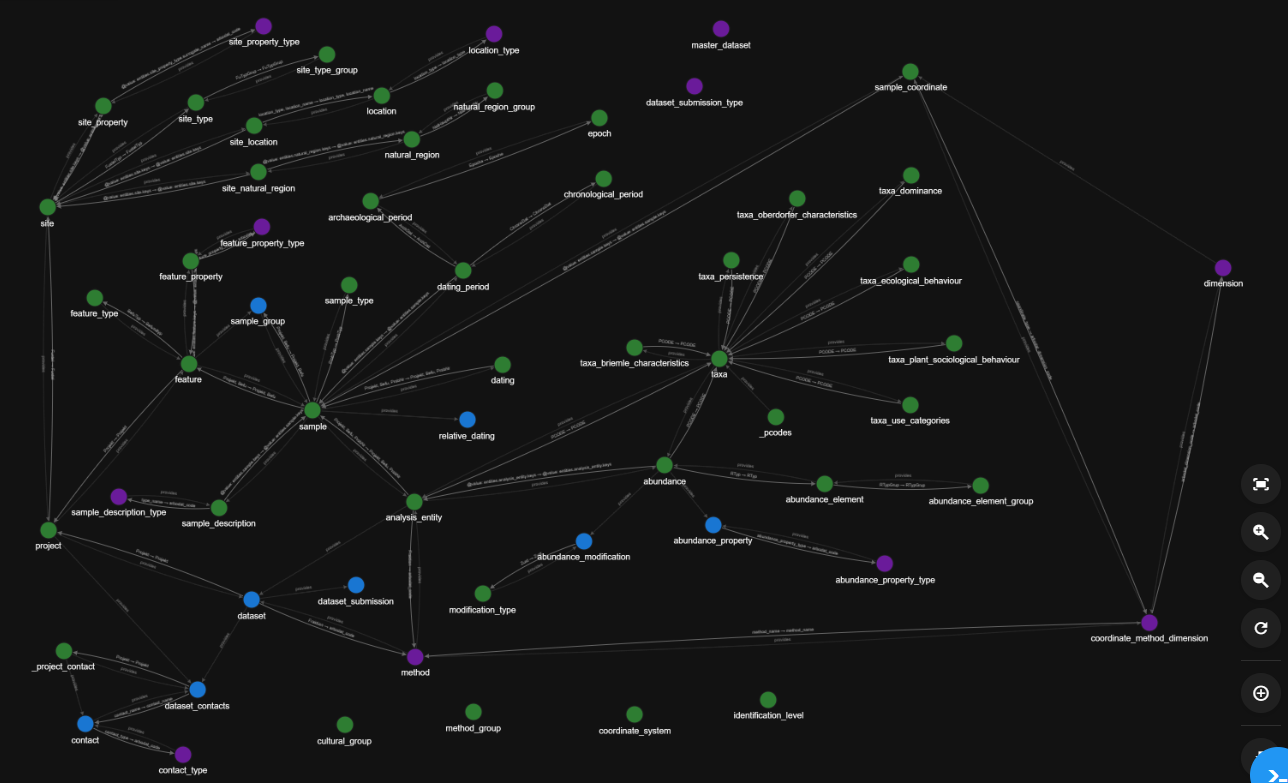
It is possible to drag nodes to a location when in any of the above views.
This is helpful to create an easier to read graph, for example by pulling nodes to a new position to uncross the connection lines between nodes.
If you have customised the graph by moving the nodes, press the Save Custom Layout button
if you wish to be able to get back to this view again after using one of the other views.
The "Clear Custom Layout" button removes the previously saved Custom Layout
It will not change the appearance of the graph on screen. If you wish to instead undo the most recent set of unsaved edits to the layout click on any of the three layout views to return to them (Hierarchical, Force Distributed, Custom)
Next: 2.3 Reconcile