The Graphs
Below are the graps of how much I am eating, on average, each month, and what percentage of that falls into the six catagories of food I track, starch, veg, protein, fruit, dairy, and other each month.
Food log: Average amount eaten each month
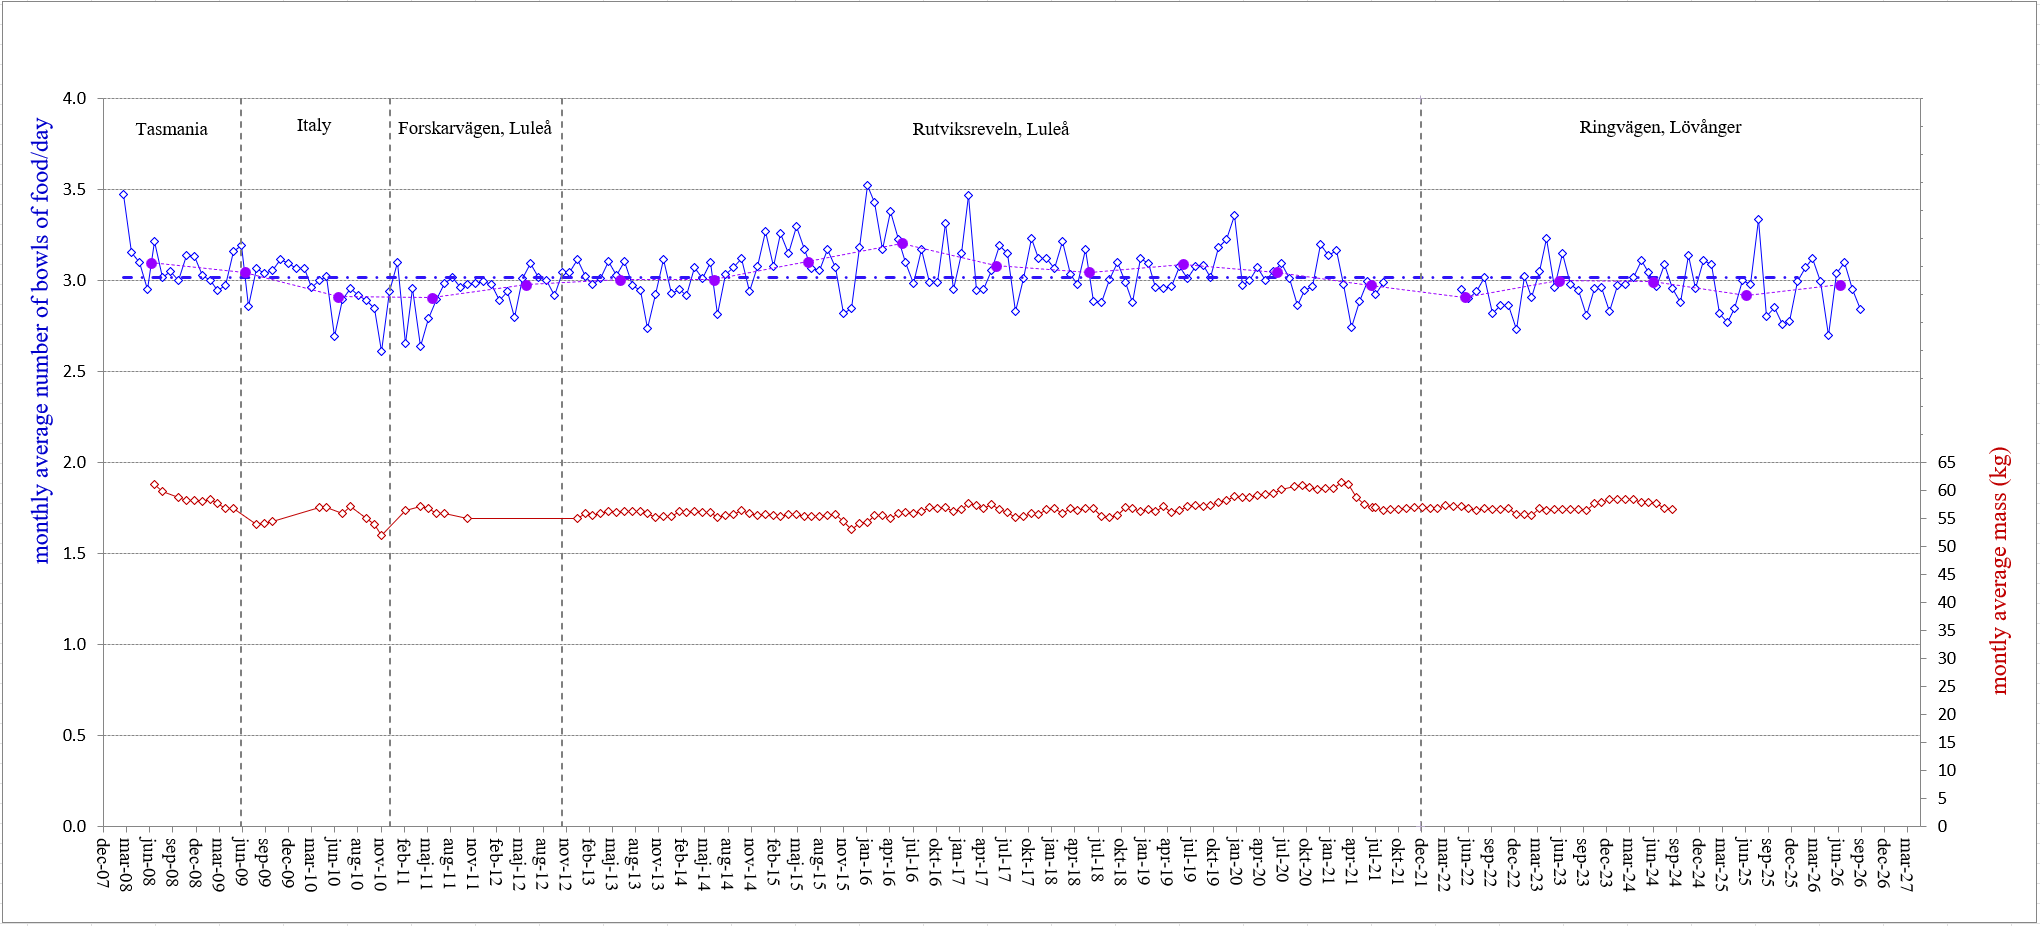
This graph shows how many bowls of food I eat each day, averaged for each month, in blue. There is also a thick blue dashed line, that shows the average number of bowls for the entire time I have been tracking (just over 3 bowls a day), and, in purple, the number of bowls eaten each day, averaged for a year (and plotted at the middle of each year, with a purple circle)
It also shows my weight, in kg, in red. The graph is divided vertically based on where I was living at the time.
This version of the graph was copied from the spreadsheet on 2026-10-20, and will, I hope, be updated each month or so. I also need to download my weight log and import those numbers into the spreadsheet, I see that it has been quite a while since that was updated.
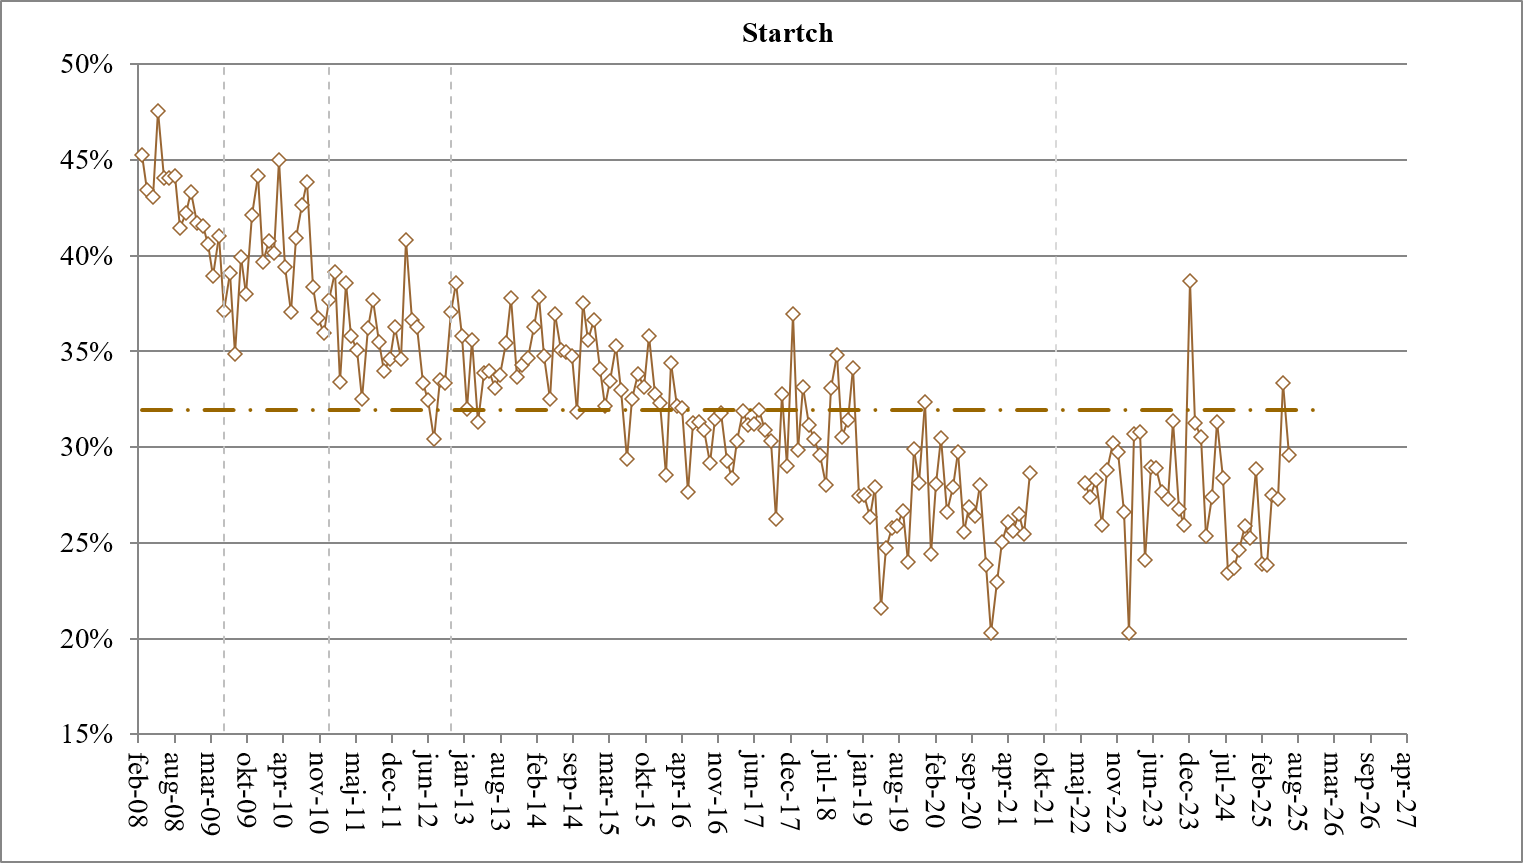
Food log: Percent starch each month, on average
Last updated on 2026-10-20
(Vertical dividing lines between different locations lived, see above for details)
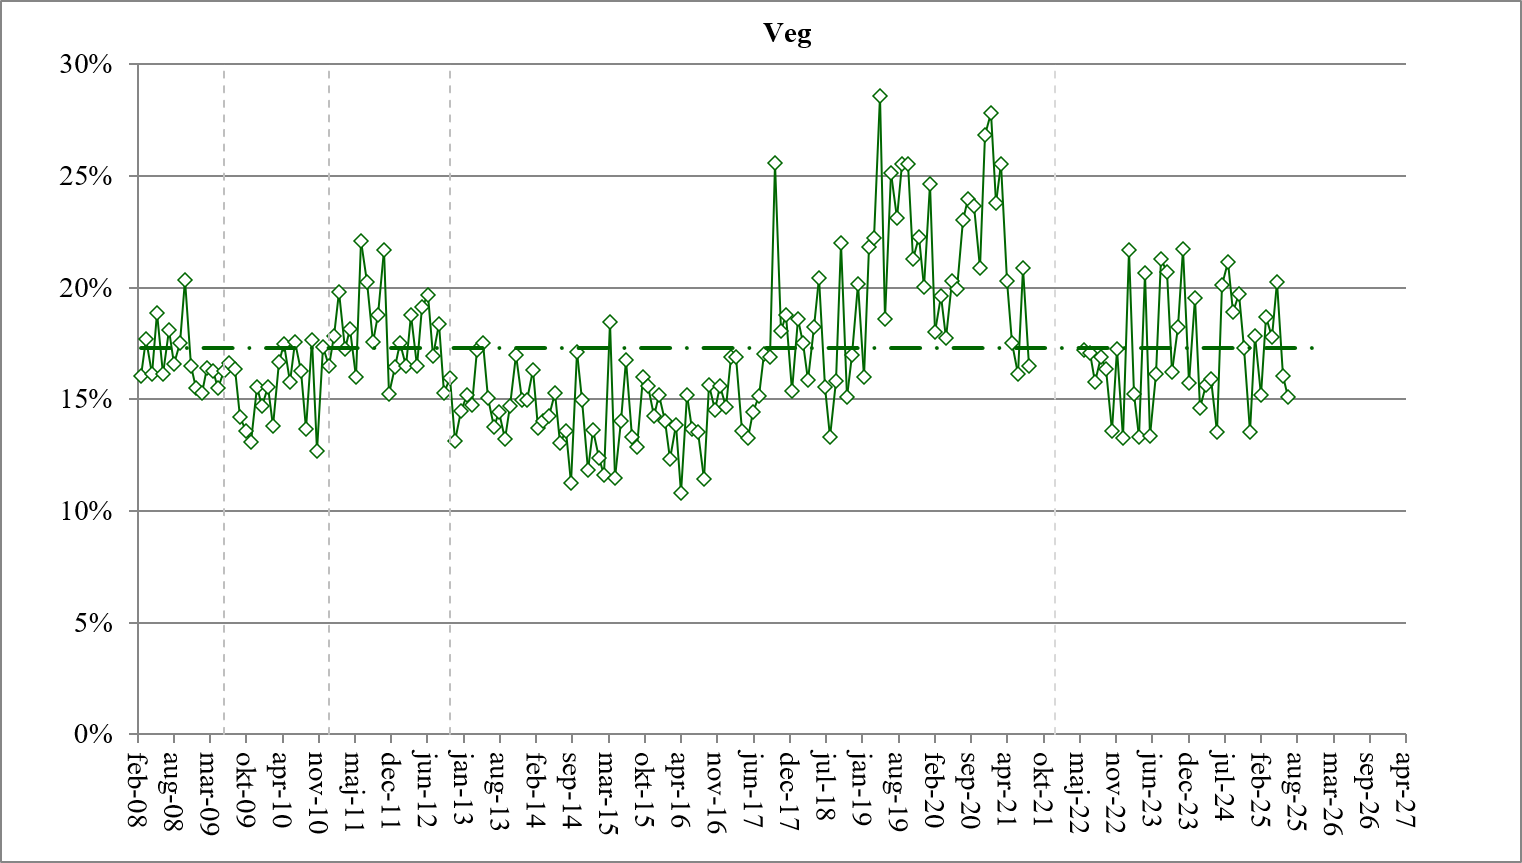
Food log: Percent veg each month, on average
Last updated on 2026-10-20
(Vertical dividing lines between different locations lived, see above for details)
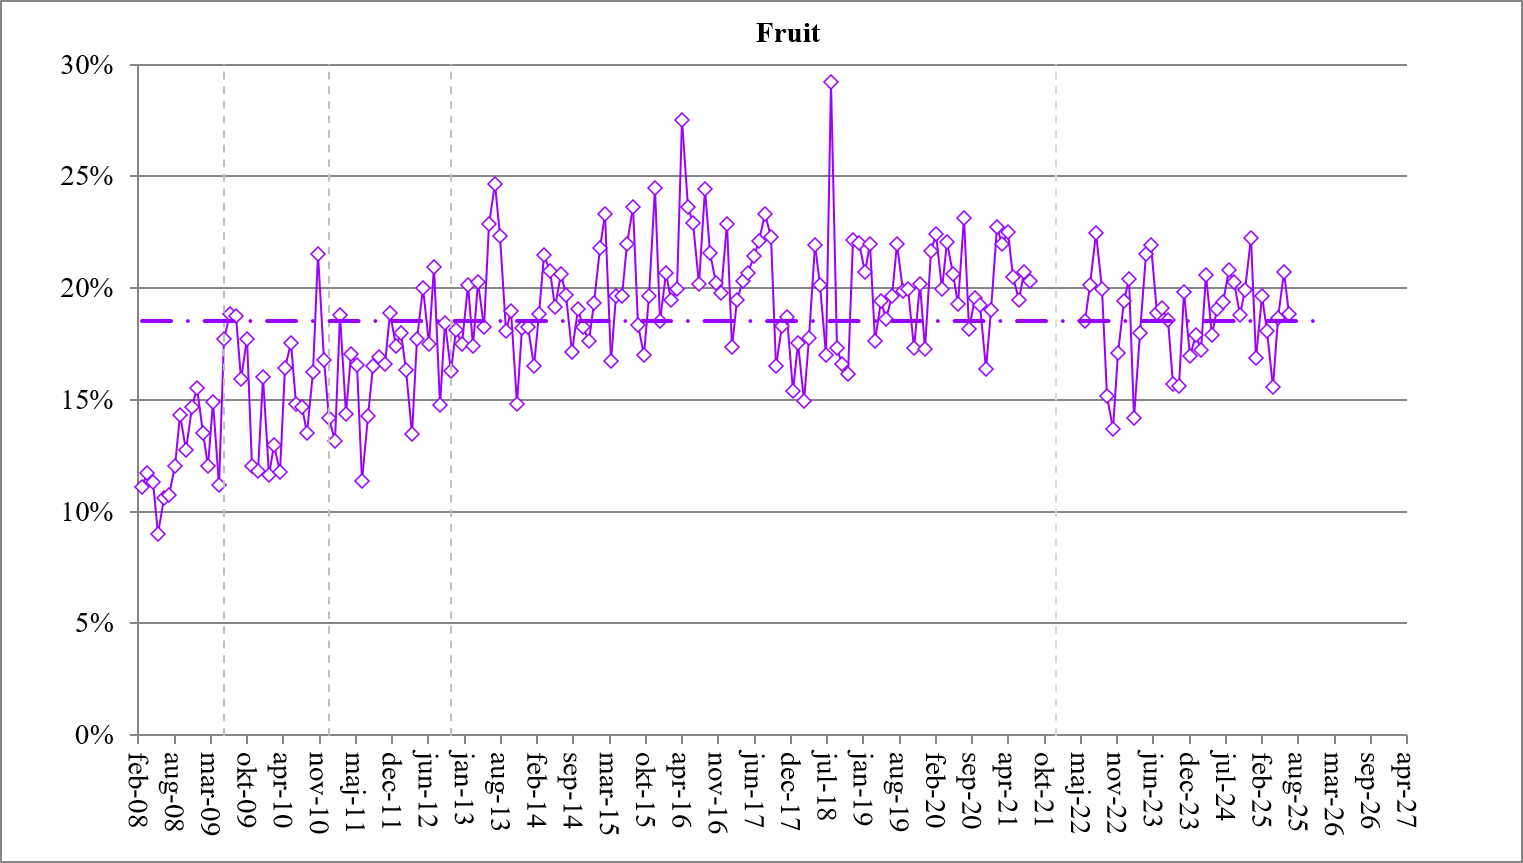
Food log: Percent fruit each month, on average
Last updated on 2026-10-20
(Vertical dividing lines between different locations lived, see above for details)
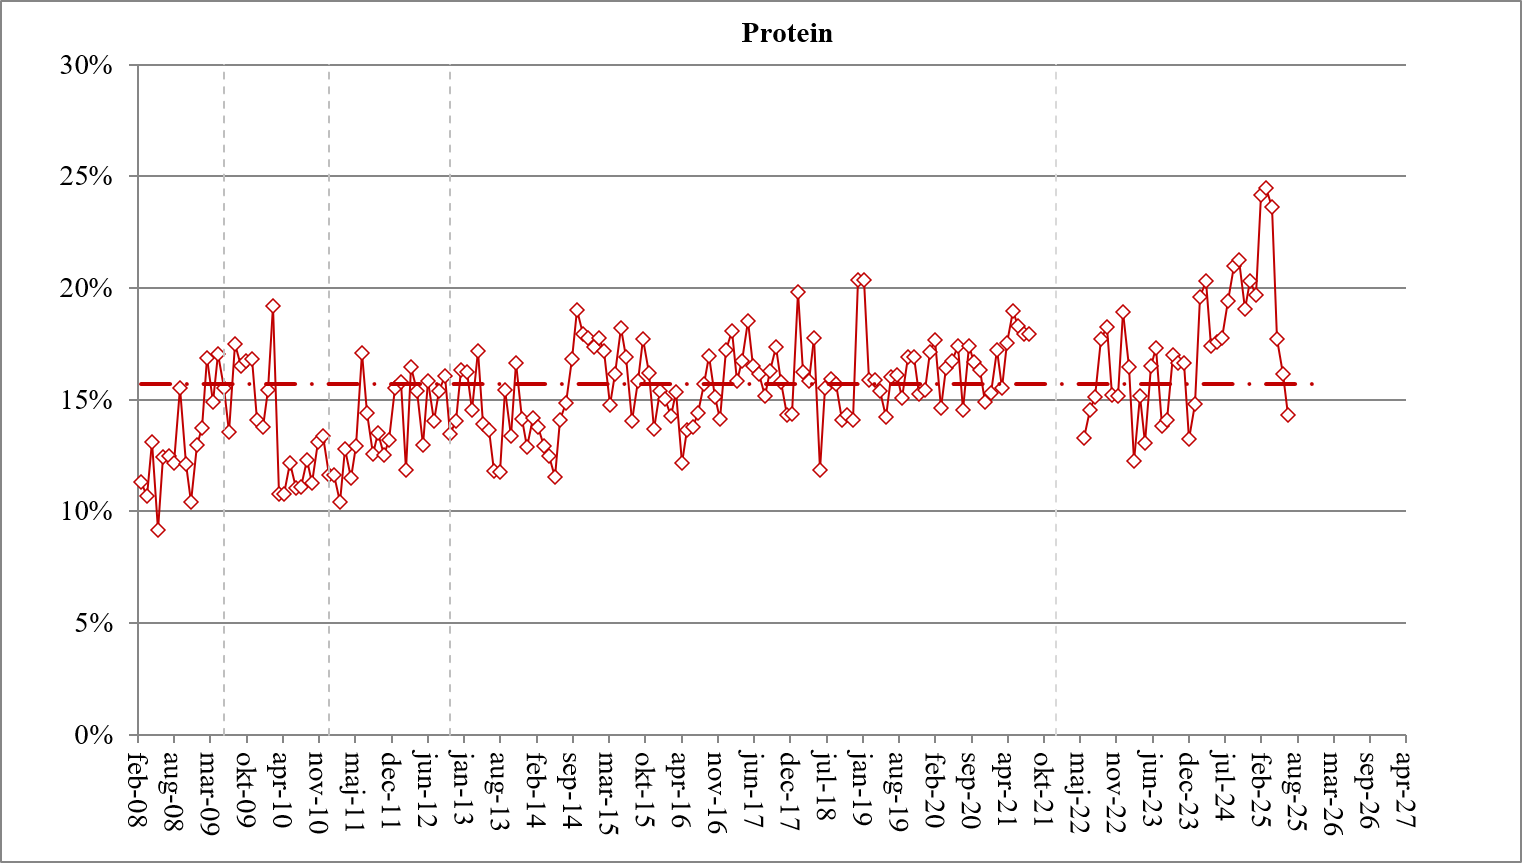
Food log: Percent protein each month, on average
Last updated on 2026-10-20
(Vertical dividing lines between different locations lived, see above for details)
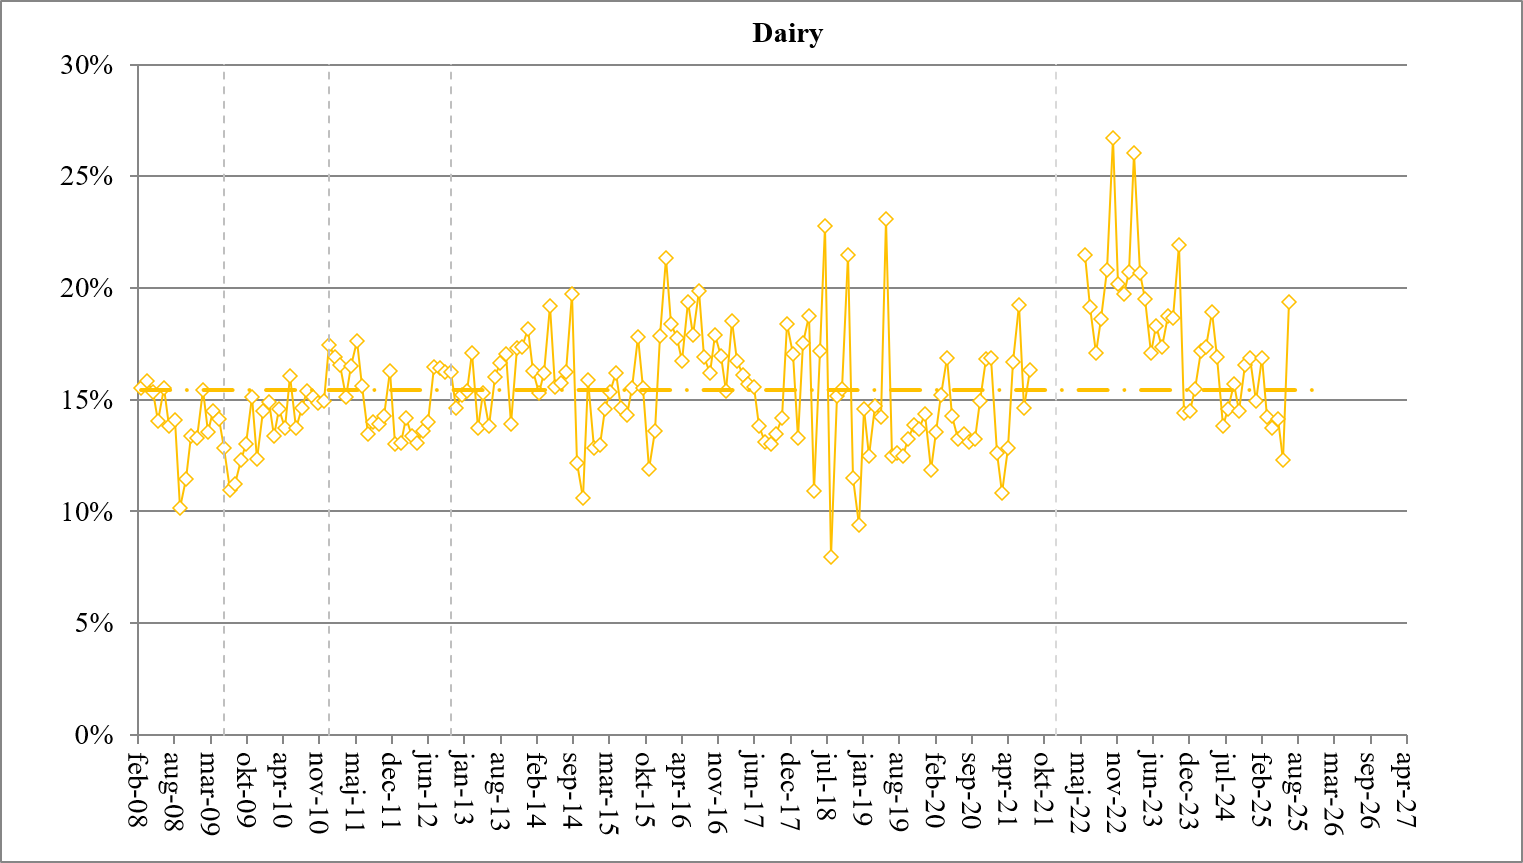
Food log: Percent dairy each month, on average
Last updated on 2026-10-20
(Vertical dividing lines between different locations lived, see above for details)
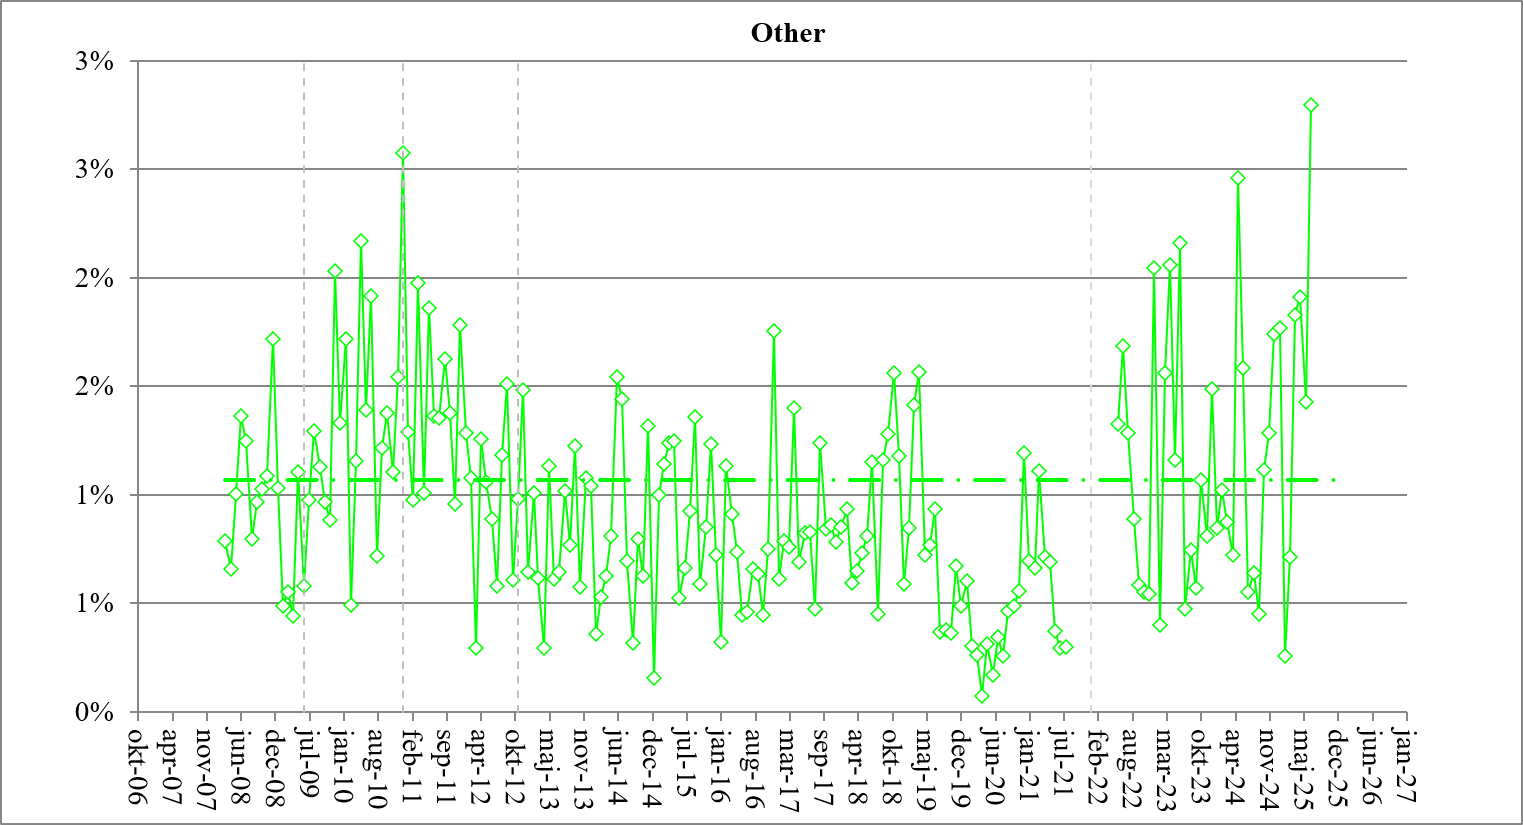
Food log: Percent other each month, on average
Last updated on 2026-10-20
(Vertical dividing lines between different locations lived, see above for details)
Jan 2024 to present
| avg # of bowls/day | protein | dairy | veg | fruit | starch | other | |
|---|---|---|---|---|---|---|---|
| jan-24 | 2.83 | 13.2% | 14.5% | 15.7% | 17.0% | 38.7% | 0.8% |
| feb-24 | 2.97 | 14.8% | 15.5% | 19.5% | 17.9% | 31.3% | 1.0% |
| mar-24 | 2.98 | 19.6% | 17.2% | 14.6% | 17.2% | 30.5% | 0.9% |
| apr-24 | 3.02 | 20.3% | 17.4% | 15.6% | 20.6% | 25.4% | 0.7% |
| maj-24 | 3.11 | 17.4% | 18.9% | 15.9% | 17.9% | 27.4% | 2.5% |
| jun-24 | 3.05 | 17.6% | 16.9% | 13.6% | 19.0% | 31.3% | 1.6% |
| jul-24 | 2.97 | 17.8% | 13.8% | 20.1% | 19.4% | 28.4% | 0.6% |
| aug-24 | 3.09 | 19.4% | 14.6% | 21.1% | 20.8% | 23.4% | 0.6% |
| sep-24 | 2.96 | 21.0% | 15.7% | 18.9% | 20.3% | 23.7% | 0.5% |
| okt-24 | 2.88 | 21.3% | 14.5% | 19.7% | 18.8% | 24.6% | 1.1% |
| nov-24 | 3.14 | 19.1% | 16.5% | 17.3% | 19.9% | 25.9% | 1.3% |
| dec-24 | 2.95 | 20.3% | 16.9% | 13.5% | 22.3% | 25.3% | 1.7% |
| jan-25 | 3.11 | 19.7% | 15.0% | 17.8% | 16.9% | 28.9% | 1.8% |
| feb-25 | 3.09 | 24.1% | 16.9% | 15.2% | 19.7% | 23.9% | 0.3% |
| mar-25 | 2.82 | 24.5% | 14.2% | 18.7% | 18.1% | 23.8% | 0.7% |
| apr-25 | 2.77 | 23.6% | 13.7% | 17.8% | 15.6% | 27.5% | 1.8% |
| maj-25 | 2.85 | 17.7% | 14.2% | 20.2% | 18.7% | 27.3% | 1.9% |
| jun-25 | 3.00 | 16.2% | 12.3% | 16.0% | 20.7% | 33.4% | 1.4% |
| jul-25 | 2.98 | 14.3% | 19.4% | 15.1% | 18.8% | 29.6% | 2.8% |
| aug-25 | 3.33 | 16.0% | 16.4% | 18.7% | 20.8% | 26.9% | 1.1% |
| sep-25 | 2.80 | 18.9% | 16.6% | 14.5% | 19.6% | 29.6% | 0.8% |
| okt-25 | 2.85 | 22.8% | 14.6% | 19.4% | 17.5% | 24.2% | 1.6% |
| nov-25 | 2.76 | 20.2% | 11.1% | 26.0% | 17.6% | 23.6% | 1.5% |
| dec-25 | 2.78 | 22.7% | 10.7% | 24.3% | 18.6% | 22.3% | 1.4% |
| jan-26 | 2.99 | 18.1% | 12.6% | 19.0% | 23.3% | 25.7% | 1.3% |
| feb-26 | 3.07 | 21.8% | 12.2% | 18.8% | 22.2% | 23.8% | 1.2% |
| mar-26 | 3.12 | 21.4% | 9.2% | 17.7% | 23.8% | 27.1% | 0.9% |
| apr-26 | 2.99 | 21.5% | 11.0% | 20.1% | 20.5% | 25.8% | 1.2% |
| maj-26 | 2.70 | 15.4% | 15.8% | 14.9% | 21.9% | 28.9% | 3.1% |
| jun-26 | 3.04 | 14.0% | 23.5% | 22.1% | 22.0% | 2.2% | 16.2% |
| jul-26 | 3.10 | 17.6% | 13.7% | 21.4% | 21.6% | 23.3% | 2.4% |
| aug-26 | 2.95 | 21.8% | 11.9% | 21.5% | 23.2% | 20.6% | 1.1% |
| sep-26 | 2.84 | 20.6% | 13.1% | 24.4% | 21.5% | 19.5% | 0.9% |
Jan 2021 to Dec 2023
Note that 2021 was the year that Keldor and I got together, started house hunting, and in December, bought a house that required much work to make liveable. As a result, for the first time since I started my food log, I wasn’t spending the same long hours a day at the computer, and I didn’t manage to track my food intake on a daily basis. Rather than record the partial data for the few days I did write it down, I simply left those months blank in this summary. Starting in June of 2022 my normal food logging resumed.
| avg # of bowls/day | protein | dairy | veg | fruit | starch | other | |
|---|---|---|---|---|---|---|---|
| jan-21 | 3.14 | 15.3% | 16.9% | 27.8% | 19.0% | 20.3% | 0.7% |
| feb-21 | 3.16 | 17.2% | 12.6% | 23.8% | 22.7% | 23.0% | 0.7% |
| mar-21 | 2.98 | 15.5% | 10.8% | 25.5% | 22.0% | 25.1% | 1.1% |
| apr-21 | 2.74 | 17.5% | 12.8% | 20.3% | 22.5% | 26.1% | 0.7% |
| maj-21 | 2.89 | 19.0% | 16.7% | 17.5% | 20.5% | 25.6% | 0.7% |
| jun-21 | 3.00 | 18.3% | 19.3% | 16.1% | 19.5% | 26.5% | 0.4% |
| jul-21 | 2.92 | 18.0% | 14.6% | 20.9% | 20.7% | 25.5% | 0.3% |
| aug-21 | 2.99 | 17.9% | 16.3% | 16.5% | 20.3% | 28.6% | 0.3% |
| sep-21 | |||||||
| okt-21 | |||||||
| nov-21 | |||||||
| dec-21 | |||||||
| jan-22 | |||||||
| feb-22 | |||||||
| mar-22 | |||||||
| apr-22 | |||||||
| maj-22 | |||||||
| jun-22 | 2.95 | 13.3% | 21.5% | 17.2% | 18.5% | 28.1% | 1.3% |
| jul-22 | 2.90 | 14.5% | 19.1% | 17.1% | 20.2% | 27.4% | 1.7% |
| aug-22 | 2.94 | 15.1% | 17.1% | 15.8% | 22.5% | 28.3% | 1.3% |
| sep-22 | 3.02 | 17.7% | 18.6% | 16.9% | 20.0% | 25.9% | 0.9% |
| okt-22 | 2.82 | 18.3% | 20.8% | 16.4% | 15.2% | 28.8% | 0.6% |
| nov-22 | 2.86 | 15.2% | 26.7% | 13.6% | 13.7% | 30.2% | 0.6% |
| dec-22 | 2.86 | 15.2% | 20.2% | 17.3% | 17.1% | 29.8% | 0.5% |
| jan-23 | 2.73 | 18.9% | 19.7% | 13.3% | 19.4% | 26.6% | 2.0% |
| feb-23 | 3.02 | 16.5% | 20.7% | 21.7% | 20.4% | 20.3% | 0.4% |
| mar-23 | 2.91 | 12.3% | 26.1% | 15.2% | 14.2% | 30.7% | 1.6% |
| apr-23 | 3.05 | 15.2% | 20.7% | 13.3% | 18.0% | 30.8% | 2.1% |
| maj-23 | 3.23 | 13.1% | 19.5% | 20.7% | 21.5% | 24.1% | 1.2% |
| jun-23 | 2.96 | 16.5% | 17.1% | 13.4% | 21.9% | 29.0% | 2.2% |
| jul-23 | 3.15 | 17.3% | 18.3% | 16.1% | 18.9% | 28.9% | 0.5% |
| aug-23 | 2.98 | 13.8% | 17.4% | 21.3% | 19.1% | 27.7% | 0.7% |
| sep-23 | 2.95 | 14.1% | 18.7% | 20.7% | 18.6% | 27.3% | 0.6% |
| okt-23 | 2.81 | 17.0% | 18.7% | 16.2% | 15.7% | 31.4% | 1.1% |
| nov-23 | 2.96 | 16.7% | 21.9% | 18.2% | 15.6% | 26.8% | 0.8% |
| dec-23 | 2.96 | 16.6% | 14.4% | 21.7% | 19.8% | 25.9% | 1.5% |
Jan 2018 to Dec 2020
| avg # of bowls/day | protein | dairy | veg | fruit | starch | other | |
|---|---|---|---|---|---|---|---|
| jan-18 | 3.12 | 14.4% | 17.0% | 15.4% | 15.4% | 37.0% | 0.9% |
| feb-18 | 3.06 | 19.8% | 13.3% | 18.6% | 17.5% | 29.8% | 0.9% |
| mar-18 | 3.21 | 16.2% | 17.5% | 17.5% | 15.0% | 33.1% | 0.6% |
| apr-18 | 3.03 | 15.8% | 18.7% | 15.9% | 17.8% | 31.1% | 0.7% |
| maj-18 | 2.98 | 17.8% | 10.9% | 18.2% | 21.9% | 30.4% | 0.7% |
| jun-18 | 3.17 | 11.9% | 17.2% | 20.4% | 20.2% | 29.6% | 0.8% |
| jul-18 | 2.88 | 15.5% | 22.8% | 15.6% | 17.0% | 28.0% | 1.2% |
| aug-18 | 2.88 | 15.9% | 8.0% | 13.3% | 29.2% | 33.1% | 0.5% |
| sep-18 | 3.01 | 15.7% | 15.2% | 15.8% | 17.3% | 34.8% | 1.2% |
| okt-18 | 3.10 | 14.1% | 15.5% | 22.0% | 16.6% | 30.5% | 1.3% |
| nov-18 | 2.99 | 14.3% | 21.5% | 15.1% | 16.2% | 31.4% | 1.6% |
| dec-18 | 2.88 | 14.1% | 11.5% | 17.0% | 22.1% | 34.1% | 1.2% |
| jan-19 | 3.12 | 20.4% | 9.4% | 20.2% | 22.0% | 27.5% | 0.6% |
| feb-19 | 3.10 | 20.3% | 14.6% | 16.0% | 20.7% | 27.5% | 0.8% |
| mar-19 | 2.96 | 15.9% | 12.5% | 21.8% | 22.0% | 26.4% | 1.4% |
| apr-19 | 2.96 | 15.9% | 14.7% | 22.2% | 17.6% | 27.9% | 1.6% |
| maj-19 | 2.97 | 15.4% | 14.2% | 28.6% | 19.4% | 21.6% | 0.7% |
| jun-19 | 3.08 | 14.2% | 23.1% | 18.6% | 18.6% | 24.7% | 0.8% |
| jul-19 | 3.01 | 16.0% | 12.5% | 25.1% | 19.6% | 25.8% | 0.9% |
| aug-19 | 3.08 | 16.1% | 12.6% | 23.1% | 22.0% | 25.9% | 0.4% |
| sep-19 | 3.08 | 15.1% | 12.5% | 25.5% | 19.9% | 26.7% | 0.4% |
| okt-19 | 3.02 | 16.9% | 13.3% | 25.6% | 19.9% | 24.0% | 0.4% |
| nov-19 | 3.18 | 16.9% | 13.9% | 21.3% | 17.3% | 29.9% | 0.7% |
| dec-19 | 3.23 | 15.2% | 13.7% | 22.3% | 20.2% | 28.1% | 0.5% |
| jan-20 | 3.36 | 15.4% | 14.4% | 20.0% | 17.3% | 32.4% | 0.6% |
| feb-20 | 2.97 | 17.1% | 11.9% | 24.6% | 21.6% | 24.4% | 0.3% |
| mar-20 | 3.00 | 17.7% | 13.6% | 18.0% | 22.4% | 28.1% | 0.3% |
| apr-20 | 3.07 | 14.6% | 15.2% | 19.6% | 20.0% | 30.5% | 0.1% |
| maj-20 | 3.00 | 16.4% | 16.9% | 17.7% | 22.0% | 26.6% | 0.3% |
| jun-20 | 3.05 | 16.7% | 14.3% | 20.3% | 20.6% | 27.9% | 0.2% |
| jul-20 | 3.09 | 17.4% | 13.3% | 20.0% | 19.3% | 29.7% | 0.3% |
| aug-20 | 3.01 | 14.5% | 13.5% | 23.0% | 23.1% | 25.6% | 0.3% |
| sep-20 | 2.87 | 17.4% | 13.1% | 24.0% | 18.2% | 26.9% | 0.5% |
| okt-20 | 2.95 | 16.7% | 13.2% | 23.6% | 19.6% | 26.4% | 0.5% |
| nov-20 | 2.97 | 16.3% | 15.0% | 20.9% | 19.3% | 28.0% | 0.6% |
| dec-20 | 3.20 | 14.9% | 16.8% | 26.9% | 16.4% | 23.9% | 1.2% |
Jan 2014 to Dec 2017
| avg # of bowls/day | protein | dairy | veg | fruit | starch | other | |
|---|---|---|---|---|---|---|---|
| jan-14 | 2.93 | 12.9% | 18.2% | 15.0% | 18.2% | 34.7% | 1.0% |
| feb-14 | 2.95 | 14.2% | 16.3% | 16.3% | 16.5% | 36.3% | 0.4% |
| mar-14 | 2.92 | 13.8% | 15.3% | 13.7% | 18.8% | 37.8% | 0.5% |
| apr-14 | 3.07 | 12.9% | 16.2% | 14.0% | 21.5% | 34.8% | 0.6% |
| maj-14 | 3.01 | 12.5% | 19.2% | 14.3% | 20.7% | 32.5% | 0.8% |
| jun-14 | 3.10 | 11.5% | 15.6% | 15.3% | 19.2% | 36.9% | 1.5% |
| jul-14 | 2.82 | 14.1% | 15.7% | 13.0% | 20.6% | 35.1% | 1.4% |
| aug-14 | 3.03 | 14.8% | 16.2% | 13.6% | 19.7% | 35.0% | 0.7% |
| sep-14 | 3.07 | 16.8% | 19.7% | 11.2% | 17.1% | 34.8% | 0.3% |
| okt-14 | 3.12 | 19.0% | 12.2% | 17.1% | 19.1% | 31.8% | 0.8% |
| nov-14 | 2.94 | 18.0% | 10.6% | 15.0% | 18.3% | 37.5% | 0.6% |
| dec-14 | 3.08 | 17.8% | 15.9% | 11.8% | 17.6% | 35.6% | 1.3% |
| jan-15 | 3.27 | 17.4% | 12.9% | 13.6% | 19.3% | 36.7% | 0.2% |
| feb-15 | 3.08 | 17.8% | 13.0% | 12.4% | 21.8% | 34.1% | 1.0% |
| mar-15 | 3.26 | 17.2% | 14.6% | 11.6% | 23.3% | 32.2% | 1.1% |
| apr-15 | 3.15 | 14.7% | 15.4% | 18.5% | 16.7% | 33.5% | 1.2% |
| maj-15 | 3.29 | 16.1% | 16.2% | 11.5% | 19.6% | 35.3% | 1.2% |
| jun-15 | 3.17 | 18.2% | 14.7% | 14.0% | 19.7% | 33.0% | 0.5% |
| jul-15 | 3.07 | 16.9% | 14.3% | 16.7% | 22.0% | 29.4% | 0.7% |
| aug-15 | 3.06 | 14.1% | 15.5% | 13.3% | 23.6% | 32.5% | 0.9% |
| sep-15 | 3.17 | 15.9% | 17.8% | 12.8% | 18.3% | 33.8% | 1.4% |
| okt-15 | 3.07 | 17.7% | 15.5% | 16.0% | 17.0% | 33.1% | 0.6% |
| nov-15 | 2.82 | 16.2% | 11.9% | 15.6% | 19.6% | 35.8% | 0.9% |
| dec-15 | 2.85 | 13.7% | 13.6% | 14.3% | 24.5% | 32.8% | 1.2% |
| jan-16 | 3.18 | 15.4% | 17.8% | 15.2% | 18.5% | 32.3% | 0.7% |
| feb-16 | 3.52 | 15.0% | 21.4% | 14.0% | 20.7% | 28.6% | 0.3% |
| mar-16 | 3.43 | 14.3% | 18.4% | 12.3% | 19.5% | 34.4% | 1.1% |
| apr-16 | 3.17 | 15.3% | 17.8% | 13.9% | 20.0% | 32.2% | 0.9% |
| maj-16 | 3.38 | 12.1% | 16.7% | 10.8% | 27.5% | 32.0% | 0.7% |
| jun-16 | 3.22 | 13.7% | 19.4% | 15.2% | 23.6% | 27.7% | 0.4% |
| jul-16 | 3.10 | 13.8% | 17.9% | 13.7% | 22.9% | 31.3% | 0.5% |
| aug-16 | 2.99 | 14.4% | 19.8% | 13.6% | 20.2% | 31.3% | 0.7% |
| sep-16 | 3.17 | 15.7% | 16.9% | 11.4% | 24.5% | 30.9% | 0.6% |
| okt-16 | 2.99 | 17.0% | 16.2% | 15.6% | 21.6% | 29.2% | 0.4% |
| nov-16 | 2.99 | 15.1% | 17.9% | 14.5% | 20.2% | 31.5% | 0.8% |
| dec-16 | 3.31 | 14.1% | 17.0% | 15.6% | 19.8% | 31.8% | 1.8% |
| jan-17 | 2.95 | 17.2% | 15.4% | 14.7% | 22.9% | 29.3% | 0.6% |
| feb-17 | 3.15 | 18.1% | 18.5% | 16.9% | 17.4% | 28.4% | 0.8% |
| mar-17 | 3.47 | 15.8% | 16.7% | 16.9% | 19.5% | 30.3% | 0.8% |
| apr-17 | 2.94 | 16.7% | 16.1% | 13.6% | 20.3% | 31.9% | 1.4% |
| maj-17 | 2.95 | 18.5% | 15.7% | 13.3% | 20.7% | 31.1% | 0.7% |
| jun-17 | 3.06 | 16.5% | 15.6% | 14.4% | 21.4% | 31.2% | 0.8% |
| jul-17 | 3.19 | 16.1% | 13.8% | 15.2% | 22.1% | 31.9% | 0.8% |
| aug-17 | 3.15 | 15.2% | 13.1% | 17.0% | 23.3% | 30.9% | 0.5% |
| sep-17 | 2.83 | 16.3% | 13.0% | 16.9% | 22.3% | 30.3% | 1.2% |
| okt-17 | 3.01 | 17.3% | 13.5% | 25.6% | 16.5% | 26.2% | 0.8% |
| nov-17 | 3.23 | 15.8% | 14.2% | 18.0% | 18.3% | 32.8% | 0.9% |
| dec-17 | 3.12 | 14.3% | 18.4% | 18.8% | 18.7% | 29.0% | 0.8% |
Jan 2011 to Dec 2013
| avg # of bowls/day | protein | dairy | veg | fruit | starch | other | |
|---|---|---|---|---|---|---|---|
| jan-11 | 2.94 | 11.6% | 17.4% | 16.5% | 14.2% | 37.7% | 2.6% |
| feb-11 | 3.10 | 11.6% | 16.9% | 17.8% | 13.2% | 39.1% | 1.3% |
| mar-11 | 2.65 | 10.4% | 16.6% | 19.8% | 18.8% | 33.4% | 1.0% |
| apr-11 | 2.96 | 12.8% | 15.1% | 17.2% | 14.4% | 38.6% | 2.0% |
| maj-11 | 2.64 | 11.5% | 16.5% | 18.1% | 17.1% | 35.8% | 1.0% |
| jun-11 | 2.79 | 12.9% | 17.6% | 16.0% | 16.6% | 35.1% | 1.9% |
| jul-11 | 2.90 | 17.1% | 15.6% | 22.1% | 11.3% | 32.5% | 1.4% |
| aug-11 | 2.98 | 14.4% | 13.5% | 20.3% | 14.3% | 36.2% | 1.4% |
| sep-11 | 3.02 | 12.6% | 14.0% | 17.6% | 16.5% | 37.7% | 1.6% |
| okt-11 | 2.96 | 13.5% | 13.9% | 18.8% | 16.9% | 35.5% | 1.4% |
| nov-11 | 2.98 | 12.5% | 14.3% | 21.7% | 16.6% | 34.0% | 1.0% |
| dec-11 | 2.98 | 13.2% | 16.3% | 15.2% | 18.9% | 34.6% | 1.8% |
| jan-12 | 2.99 | 15.5% | 13.0% | 16.5% | 17.4% | 36.3% | 1.3% |
| feb-12 | 2.98 | 15.8% | 13.1% | 17.5% | 18.0% | 34.6% | 1.1% |
| mar-12 | 2.89 | 11.8% | 14.2% | 16.5% | 16.3% | 40.8% | 0.3% |
| apr-12 | 2.94 | 16.5% | 13.4% | 18.8% | 13.5% | 36.6% | 1.3% |
| maj-12 | 2.80 | 15.4% | 13.1% | 16.5% | 17.7% | 36.3% | 1.1% |
| jun-12 | 3.01 | 13.0% | 13.6% | 19.2% | 20.0% | 33.3% | 0.9% |
| jul-12 | 3.10 | 15.8% | 14.0% | 19.7% | 17.5% | 32.5% | 0.6% |
| aug-12 | 3.02 | 14.1% | 16.5% | 16.9% | 21.0% | 30.4% | 1.2% |
| sep-12 | 3.00 | 15.4% | 16.4% | 18.4% | 14.8% | 33.5% | 1.5% |
| okt-12 | 2.92 | 16.1% | 16.2% | 15.3% | 18.4% | 33.4% | 0.6% |
| nov-12 | 3.05 | 13.5% | 16.3% | 16.0% | 16.3% | 37.0% | 1.0% |
| dec-12 | 3.04 | 14.0% | 14.6% | 13.2% | 18.1% | 38.6% | 1.5% |
| jan-13 | 3.12 | 16.3% | 15.2% | 14.5% | 17.5% | 35.8% | 0.6% |
| feb-13 | 3.02 | 16.2% | 15.4% | 15.2% | 20.2% | 32.0% | 1.0% |
| mar-13 | 2.98 | 14.5% | 17.1% | 14.7% | 17.4% | 35.6% | 0.6% |
| apr-13 | 3.01 | 17.2% | 13.7% | 17.2% | 20.3% | 31.3% | 0.3% |
| maj-13 | 3.10 | 13.9% | 15.3% | 17.5% | 18.3% | 33.9% | 1.1% |
| jun-13 | 3.03 | 13.6% | 13.8% | 15.1% | 22.9% | 34.0% | 0.6% |
| jul-13 | 3.10 | 11.8% | 16.0% | 13.8% | 24.6% | 33.1% | 0.6% |
| aug-13 | 2.97 | 11.8% | 16.7% | 14.4% | 22.3% | 33.8% | 1.0% |
| sep-13 | 2.95 | 15.4% | 17.0% | 13.2% | 18.1% | 35.5% | 0.8% |
| okt-13 | 2.74 | 13.4% | 13.9% | 14.7% | 19.0% | 37.8% | 1.2% |
| nov-13 | 2.93 | 16.7% | 17.3% | 17.0% | 14.8% | 33.7% | 0.6% |
| dec-13 | 3.12 | 14.1% | 17.3% | 15.0% | 18.2% | 34.3% | 1.1% |
March 2008 to Dec 2010
I started keeping my food log in this form in late March, 2008, so that month shows only 11 days of data. The total amount I ate those days (an average of 3.47 bowls. My favourite bowl holds nearly 500 ml, or just over 2 c) looked like a lot, so already the next month the total had reduced, and it has stayed lower than than initial first two weeks of recording ever since.
| avg # of bowls/day | protein | dairy | veg | fruit | starch | other | |
|---|---|---|---|---|---|---|---|
| mar-08 | 3.47 | 11.3% | 15.5% | 16.0% | 11.1% | 45.2% | 0.8% |
| apr-08 | 3.15 | 10.7% | 15.8% | 17.7% | 11.7% | 43.4% | 0.7% |
| maj-08 | 3.10 | 13.1% | 15.3% | 16.1% | 11.3% | 43.1% | 1.0% |
| jun-08 | 2.95 | 9.2% | 14.1% | 18.9% | 9.0% | 47.5% | 1.4% |
| jul-08 | 3.22 | 12.4% | 15.5% | 16.1% | 10.6% | 44.0% | 1.2% |
| aug-08 | 3.02 | 12.5% | 13.8% | 18.1% | 10.7% | 44.1% | 0.8% |
| sep-08 | 3.05 | 12.2% | 14.1% | 16.6% | 12.0% | 44.1% | 1.0% |
| okt-08 | 3.00 | 15.5% | 10.1% | 17.5% | 14.3% | 41.5% | 1.0% |
| nov-08 | 3.14 | 12.1% | 11.5% | 20.3% | 12.8% | 42.2% | 1.1% |
| dec-08 | 3.13 | 10.4% | 13.4% | 16.5% | 14.7% | 43.3% | 1.7% |
| jan-09 | 3.03 | 13.0% | 13.3% | 15.5% | 15.5% | 41.7% | 1.0% |
| feb-09 | 3.00 | 13.7% | 15.4% | 15.3% | 13.5% | 41.5% | 0.5% |
| mar-09 | 2.94 | 16.9% | 13.6% | 16.4% | 12.0% | 40.6% | 0.6% |
| apr-09 | 2.97 | 14.9% | 14.5% | 16.3% | 14.9% | 38.9% | 0.4% |
| maj-09 | 3.16 | 17.0% | 14.1% | 15.5% | 11.2% | 41.0% | 1.1% |
| jun-09 | 3.19 | 15.5% | 12.8% | 16.3% | 17.7% | 37.1% | 0.6% |
| jul-09 | 2.86 | 13.6% | 10.9% | 16.6% | 18.8% | 39.1% | 1.0% |
| aug-09 | 3.07 | 17.5% | 11.2% | 16.4% | 18.7% | 34.9% | 1.3% |
| sep-09 | 3.04 | 16.5% | 12.3% | 14.2% | 15.9% | 39.9% | 1.1% |
| okt-09 | 3.06 | 16.7% | 13.0% | 13.6% | 17.7% | 38.0% | 1.0% |
| nov-09 | 3.12 | 16.8% | 15.1% | 13.1% | 12.0% | 42.1% | 0.9% |
| dec-09 | 3.10 | 14.1% | 12.4% | 15.5% | 11.8% | 44.2% | 2.0% |
| jan-10 | 3.07 | 13.8% | 14.5% | 14.7% | 16.0% | 39.6% | 1.3% |
| feb-10 | 3.07 | 15.4% | 14.9% | 15.5% | 11.6% | 40.8% | 1.7% |
| mar-10 | 2.96 | 19.2% | 13.4% | 13.8% | 13.0% | 40.1% | 0.5% |
| apr-10 | 3.00 | 10.8% | 14.6% | 16.7% | 11.8% | 45.0% | 1.2% |
| maj-10 | 3.02 | 10.8% | 13.7% | 17.5% | 16.4% | 39.4% | 2.2% |
| jun-10 | 2.69 | 12.2% | 16.0% | 15.8% | 17.6% | 37.1% | 1.4% |
| jul-10 | 2.90 | 11.0% | 13.8% | 17.6% | 14.8% | 40.9% | 1.9% |
| aug-10 | 2.95 | 11.1% | 14.6% | 16.3% | 14.7% | 42.6% | 0.7% |
| sep-10 | 2.92 | 12.3% | 15.4% | 13.7% | 13.5% | 43.9% | 1.2% |
| okt-10 | 2.89 | 11.3% | 15.1% | 17.6% | 16.2% | 38.3% | 1.4% |
| nov-10 | 2.85 | 13.1% | 14.9% | 12.7% | 21.5% | 36.7% | 1.1% |
| dec-10 | 2.61 | 13.4% | 15.0% | 17.3% | 16.8% | 36.0% | 1.5% |